Type 2 Diabetes in Black Women
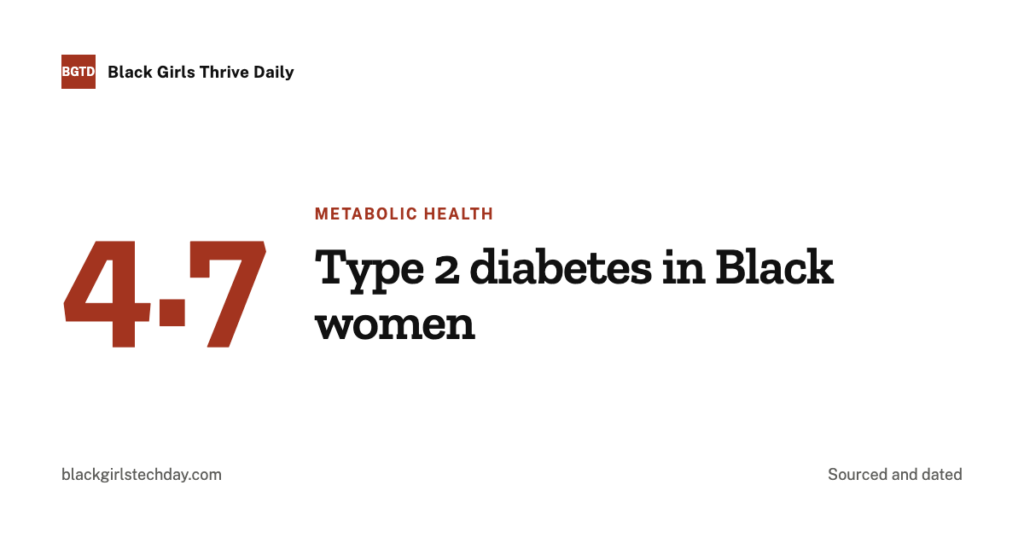
Type 2 diabetes is more common in Black adults, 17.4 percent versus 13.6 percent in White adults, but the sharpest gap is in diabetes that nobody has found yet: 4.7 percent undiagnosed versus 2.7 percent. Prediabetes rates are not higher. The disparity sits in detection, progression and complications, and A1C alone does not settle a diagnosis.
The CDC’s National Diabetes Statistics Report counts 40.1 million people in the United States with diabetes, 12.0 percent of the population, plus 115.2 million adults with prediabetes. Non-Hispanic Black adults carry a total diabetes prevalence of 17.4 percent against 13.6 percent in White adults. The HHS Office of Minority Health puts diagnosed diabetes at 12.4 percent in Black adults against 10.0 percent of all US adults. Those are the headline numbers. They are not the interesting ones.
What does the prevalence data actually show?
Black adults have a higher total diabetes prevalence than White, Asian or Hispanic adults, but the margin is smaller than the popular framing suggests. The CDC’s National Diabetes Statistics Report puts total diabetes at 17.4 percent in non-Hispanic Black adults, 16.7 percent in Asian adults, 15.5 percent in Hispanic adults and 13.6 percent in White adults.
That is a real gap of 3.8 percentage points over White adults. It is not the two-fold or three-fold difference that circulates in this niche. Asian adults sit closer to Black adults than to White adults, which is the first sign that a simple story about race and metabolic risk does not hold.
Nationally, the CDC counts 40.1 million people with diabetes and 115.2 million adults with prediabetes. Diagnosed diabetes specifically runs at 12.4 percent in Black adults compared with 10.0 percent across all US adults, according to the HHS Office of Minority Health. The CDC does not publish diagnosed diabetes for Black women as a separate figure, so any page that gives you one has invented it.
Why is undiagnosed diabetes the number that matters most?
Because it is the largest gap in the CDC’s own table. Undiagnosed diabetes runs at 4.7 percent among Black adults and 2.7 percent among White adults. That is not a modest difference. It means the ratio of people walking around with diabetes and no diagnosis is roughly three quarters higher, and every one of those years is a year of untreated glucose doing damage.
Set the two figures side by side. The total prevalence gap is 3.8 points. The undiagnosed gap is 2.0 points on a much smaller base. Proportionally, the failure to detect diabetes is the more extreme disparity, and it is the one that responds to something a reader can actually do, which is get tested and get the right test.
Undiagnosed diabetes is diabetes that is already progressing, without treatment, without monitoring and without anyone counting it. Delayed diagnosis is a pattern rather than an accident, and it shows up across conditions. The same delay drives the treatment gap documented for uterine fibroids in Black women.
Is prediabetes more common in Black adults?
No. This is the most commonly published error in this niche, and the CDC’s own Table 4 contradicts it directly. Prediabetes prevalence is 39.2 percent in Black adults and 38.7 percent in White adults, against 38.0 percent of all adults. The CDC’s own wording for the pattern across groups is that prediabetes was “similar among all racial and ethnic groups”.
Half a percentage point is not a disparity. Asian adults sit at 37.3 percent and Hispanic adults at 34.5 percent, all clustered inside a five-point band. If higher prediabetes rates were driving the diabetes gap, that table would look completely different.
So where does the gap come from? Not from who arrives at prediabetes. It comes from what happens next: how many people are told they have it, how quickly it progresses, how promptly the diabetes that follows is caught, and how the complications land. Writing “Black women have far higher prediabetes rates” is both false and strategically useless, because it points attention at the one stage of this pathway where the numbers are level.
What are the actual diagnostic thresholds?
The American Diabetes Association sets the numbers, and they are the same numbers for everyone. There are three routine tests, each with a prediabetes band and a diabetes threshold. A number inside the prediabetes band is a risk category, not a disease diagnosis.
| Test | Prediabetes | Diabetes |
|---|---|---|
| A1C | 5.7 to 6.4 percent (39 to 47 mmol/mol) | 6.5 percent or higher (48 mmol/mol) |
| Fasting plasma glucose | 100 to 125 mg/dL | 126 mg/dL or higher |
| 2-hour oral glucose tolerance test | 140 to 199 mg/dL | 200 mg/dL or higher |
| Random plasma glucose | Not used for prediabetes | 200 mg/dL or higher with classic symptoms |
One rule matters more than the thresholds themselves. The ADA Standards of Care state that without unequivocal hyperglycemia, diagnosis requires two abnormal results. That can be two different tests from the same blood draw, or the same test repeated. A single A1C is not a diagnosis. If a result is handed to you as settled after one number, the guideline says otherwise.
Can an A1C result be misleading?
Yes, and in both directions at once, which is why the flat versions of this claim are wrong. Two documented effects push A1C the opposite way, and neither is rare in Black women. Anyone telling you A1C simply “reads high” or simply “reads low” in Black patients has taken half the evidence.
Pushing up: the ADA Standards of Care report that Black individuals average an A1C about 0.3 percentage points higher than non-Hispanic White or Hispanic people at the same measured glucose.
Pushing down: Lacy and colleagues, writing in JAMA, studied 4,620 African American adults and found that at the same fasting glucose, A1C was 5.72 percent in people with sickle cell trait and 6.01 percent without, a difference of 0.29 points (95 percent CI -0.35 to -0.23). Prediabetes was classified in 29.2 percent of the sickle cell trait group against 48.6 percent of the others. Same glucose, and nearly half the detection rate. The NIDDK reports that about 1 in 13 African Americans has sickle cell trait. The G6PD G202A variant, carried by 11 percent of Black Americans, lowers A1C further, by about 0.8 points in homozygous men and 0.7 in women, according to the ADA.
The resolution is not to guess which effect dominates in any individual. It is ADA Recommendation 2.4: where hemoglobin variants are present, use plasma glucose criteria rather than A1C. The mechanism, the trait and what it does to a result are covered in full in A1C and sickle cell trait.
What to ask for at the appointment
Here is the position this site takes, and it is a judgement call rather than a guideline quote. When A1C is the only test on the order and sickle cell trait status is unknown, ask for a fasting plasma glucose to be drawn at the same visit, and ask whether your hemoglobin variant status is recorded anywhere in your chart. Three questions, all answerable, none of them a demand for a specific result or a self-diagnosis:
- “Is my sickle cell trait status known, and is it in this record?”
- “Can we add a fasting plasma glucose alongside the A1C, given the ADA note on hemoglobin variants?”
- “If this A1C is abnormal, what is the second test that confirms it?”
What a result means for you specifically is a clinical judgement that requires your history and an examination. Ask the questions, then let the clinician read the numbers.
When should screening start?
The US Preventive Services Task Force gives a Grade B recommendation to screen adults aged 35 to 70 who have overweight or obesity, meaning a BMI of 25 or higher, roughly every 3 years. The widespread belief that diabetes screening begins at 40 is outdated. It starts at 35.
The Task Force goes further, and this line is the one worth carrying into an appointment. It advises clinicians to “consider screening at an earlier age if the patient is from a population with a disproportionately high prevalence of diabetes”, and the populations it names include Black adults. That is not an aside in a commentary. It is in the recommendation statement itself.
So earlier screening for a Black patient is not an unusual request. It is the national preventive-services body’s stated position, and the phrase “screening at an earlier age” is the wording to use. The three-year interval is a default, not a ceiling.
What is actually at stake?
The outcomes gap is far wider than the prevalence gap, which is the strongest evidence that this is a detection and treatment problem rather than a biology problem. The HHS Office of Minority Health reports age-adjusted diabetes mortality of 35.5 per 100,000 for Black women against 18.8 for all women. That is close to double, from a prevalence difference of a few percentage points.
| Outcome | Black | Comparison |
|---|---|---|
| Diabetes death rate, age-adjusted | 35.5 per 100,000 women | 18.8 per 100,000, all women |
| Lower-limb amputation | 10.0 per 1,000 adults | 5.9 per 1,000, overall |
| Diabetes-related end-stage renal disease | 332.2 per million | 151.5 per million |
Kidney disease deserves a specific note, because the measurement itself changed. The NKF-ASN Task Force recommended immediate implementation of the CKD-EPI creatinine equation refit without the race variable, described in its published report. The old equation reported a higher eGFR for Black patients, which made kidney function look better than it was and could delay referral. Anyone tracking kidney function alongside diabetes has a direct interest in knowing which equation their lab uses. Blood pressure runs through the same organ damage, and it is covered at high blood pressure in Black women.
Where does body weight fit into this?
Here is the figure, without a lecture attached to it. NCHS Data Brief 360 reports age-adjusted obesity prevalence of 56.9 percent among non-Hispanic Black women, compared with 43.7 percent of Hispanic women, 39.8 percent of White women and 17.2 percent of Asian women. Black men are at 41.1 percent.
That figure matters here for one narrow, practical reason: the USPSTF screening trigger is a BMI of 25 or higher. A majority of Black women meet the screening criterion on that basis alone, which makes the failure to screen harder to justify, not easier. It is a reason the test should be ordered.
What that number does not do is explain the outcomes table above, and it does not belong to anyone as a personal verdict. Every figure on this page was read back against its primary document before publication, and the method is described in how we research.
When to see a clinician
Persistent thirst, urinating far more than usual, unexplained weight loss, blurred vision, wounds that heal slowly or recurring infections are all reasons to book an appointment rather than wait for a routine screening interval. If you are 35 or older with a BMI of 25 or higher and have not been screened in three years, that is the appointment to make. Bring any previous A1C results with you, and say if sickle cell trait runs in your family. Nothing on this page can diagnose you, and no threshold in the table above tells you what your own result means.
Common questions about type 2 diabetes in Black women
Does an A1C of 6.5 mean I have diabetes?
Not on its own. The ADA Standards of Care require two abnormal results without unequivocal hyperglycemia, meaning a second test or a repeat. A single A1C is a signal to confirm, not a diagnosis.
Do Black women get prediabetes more often?
No. The CDC reports 39.2 percent in Black adults and 38.7 percent in White adults, and calls prediabetes similar among all racial and ethnic groups. The disparity appears in diagnosis, progression and complications instead.
At what age should I start diabetes screening?
The USPSTF recommends screening from age 35 for adults with a BMI of 25 or higher, roughly every 3 years. It also advises considering earlier screening for populations with disproportionately high prevalence, naming Black adults.
Does sickle cell trait affect a diabetes test?
It affects A1C. In JAMA-published data, A1C ran 0.29 points lower with sickle cell trait at the same fasting glucose. The ADA advises using plasma glucose criteria where hemoglobin variants are present.
Is the eGFR race adjustment still used?
The NKF-ASN Task Force recommended immediate adoption of the race-free CKD-EPI creatinine equation. Uptake varies by laboratory, so it is reasonable to ask which equation produced your result.
Sources
- CDC, National Diabetes Statistics Report. 2023 data. Checked when this page was last reviewed.
- CDC, National Diabetes Statistics Report, Tables 1a and 4. NHANES 2017 to March 2020. Checked when this page was last reviewed.
- HHS Office of Minority Health, Diabetes and African Americans. 2021 to 2024 data. Checked when this page was last reviewed.
- American Diabetes Association, Standards of Care in Diabetes 2026, Section 2. Current. Checked when this page was last reviewed.
- Lacy ME et al., Association of Sickle Cell Trait With Hemoglobin A1c in African Americans, JAMA. Data 2000 to 2013. Checked when this page was last reviewed.
- NIDDK, Sickle Cell Trait and Other Hemoglobinopathies and Diabetes. Reviewed 2020. Checked when this page was last reviewed.
- USPSTF, Screening for Prediabetes and Type 2 Diabetes. 2021. Checked when this page was last reviewed.
- NKF-ASN Task Force, Reassessing the Inclusion of Race in Diagnosing Kidney Diseases. 2021. Checked when this page was last reviewed.
- NCHS Data Brief 360, Prevalence of Obesity and Severe Obesity Among Adults. NHANES 2017 to 2018. Checked when this page was last reviewed.
Medical disclaimer. This article is health information, not medical advice. It cannot account for your history, your medications or your test results. Talk to a licensed clinician before you change anything about your treatment. Read the full disclaimer.